For this part of the project we need to Histogram-equalize the R, G, and B images separately using the histogram-equalization program and convert the image back to tif format. This is how the original image looks like:
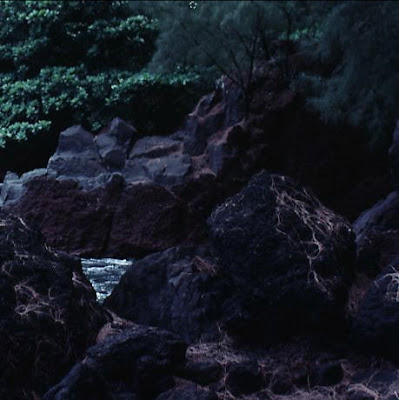
Here is what I got when I separated each channel from the original image. I basically separated by using the 'imwrite' function in octave and selected only 1 channel at a time. For example, when I wanted the 'red' channel or channel number 1 I would simply write in octave:
a=imread("darkstream.jpg");
b=double(a)/255;
imwrite("redstream.jpg", b(:,:,1));
Here are the images I got for isolating for channel 1 to 3, respectively.
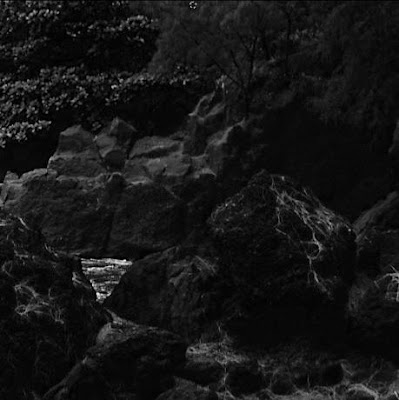
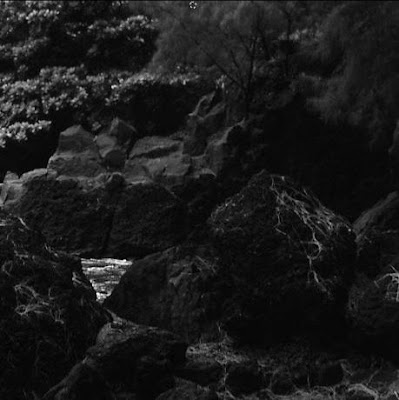
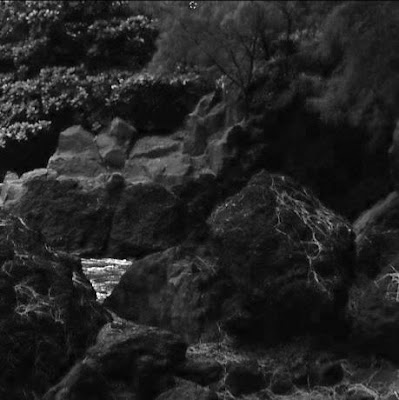
As you can observe, each channel whether it be the red,blue, or green channel, each has its own 'area' which it shows more detail than any other channel image. For example, if you look at the leaves/branches of the tree in the 'middle-right' of the original image, you will notice that the green and blue channels show more 'detail in this tree' than in say the red channel. Also, in the areas of the rocks where the 'red' is prominent, you can see these details even more through the 'red channel' image because since there is more of a red content here, all the 'reds' come out looking brighter in the 'gray' image which is made by isolating for the 'red-channel only'.
Next I need to normalize and equalize each of the images (red, green, blue) above, using octave. Here is the code I used to normalize and equalize the red channel.
A= imread("redstream.jpg");
size(A)
# normalize histogram
b=hist(A(:),256,1);
r = 0:255;
s = zeros(size(r));
for k = 1:256;
s(k) = round((2^8-1)*sum(b(1:k)));
end;
C= zeros(size(A));
for y = 1:460;
for x = 1:459;
C(y, x) = s(A(y, x)+1);
end;
end;
imwrite("redeq3.png", double(C)/255);
I then applied this same code to each of the images I got for each channel above. Here are the resulting images from red to blue, respectively.
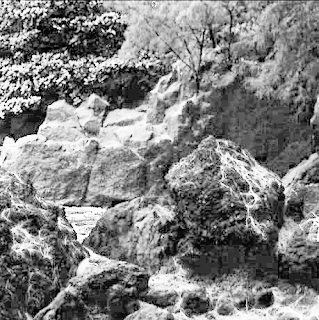
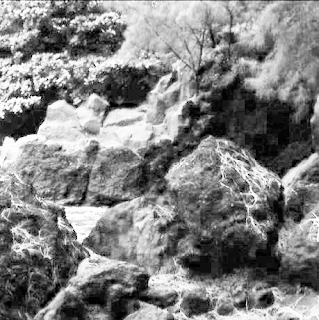
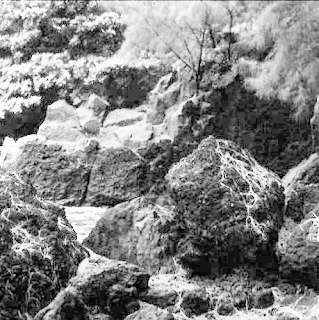
Next, I need to combine each of these 3 equlized images together to make 1 'new' image.
To do this you need to write in octave:
a=imread("redeq3.png");
b=imread("greeneq3.png");
c=imread("blueeq3.png");
A(:,:,1)=a;
A(:,:,2)=b;
A(:,:,3)=c;
imwrite("finala.png", a,b,c);
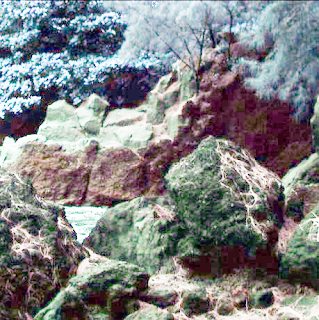
The resulting image looks like this:
* * * * * * * * * * * *
PART B:
For this part of the project we need to Form an average histogram from the three histograms in (a) and use it as the basis to obtain a single histogram equalization intensity transformation function. Apply this function to the R, G, and B components individually, and convert the results to jpg. Compare and explain the differences in the tif images in (a) and (b).
First we need to find the average histogram of the original 3 histograms we got by isoloating for 1 of 3 channels for the original image called "darkstream.jpg".
To do this in octave we need to write:
R=imread(“redstream.jpg”);
G=imread(“greenstream.jpg”);
B=imread(“bluestream.jpg”);
# normalize each channel...
hr=hist(R(:),256,1);
hg=hist(G(:),256,1);
hb=hist(B(:),256,1);
# find the average by adding all together and then divide by 3...
havg=(hr+hg+hb)/3;
# histogram equalization of Red Channel (R)
r = 0:255;
s = zeros(size(r));
for k = 1:256;
s(k) = round((2^8-1)*sum(havg(1:k)));
end;
C= zeros(size(R));
for y = 1:460; %size of image 460 by 459 pixels
for x = 1:459;
C(y, x) = s(R(y, x)+1);
end;
end;
imwrite(“Bredeq.tif”,double(C)/255);
# histogram equalization of Green Channel (G)
r = 0:255;
s = zeros(size(r));
for k = 1:256;
s(k) = round((2^8-1)*sum(havg(1:k)));
end;
C= zeros(size(G));
for y = 1:460;
for x = 1:459;
C(y, x) = s(G(y, x)+1);
end;
end;
imwrite(“Bgreeneq.tif”,double(C)/255);
# histogram equalization of Blue Channel (B)
r = 0:255;
s = zeros(size(r));
for k = 1:256;
s(k) = round((2^8-1)*sum(havg(1:k)));
end;
C= zeros(size(B));
for y = 1:460;
for x = 1:459;
C(y, x) = s(B(y, x)+1);
end;
end;
imwrite(“Bblueeq.tif”,double(C)/255);
Here are the resulting 'equalized - average images' (note that I had to rename these images to 'png' files because the blog site could not post 'tif' images):
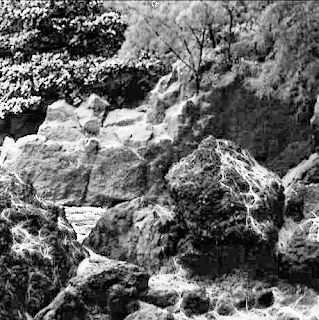
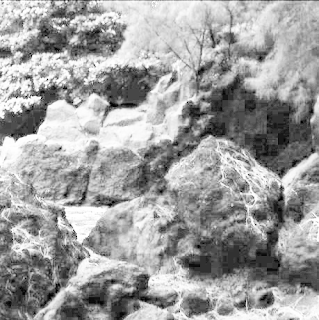
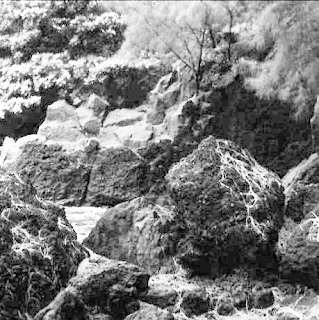
Finally, we need to combine all 3 of these equalized 'averaged' images into 1 image, much like how we did for part(A).
To do this we simply need to write the following in octave:
a=imread("Bredeq.tif");
b=imread("Bgreeneq.tif");
c=imread("Bblueeq.tif");
A(:,:,1)=a;
A(:,:,2)=b;
A(:,:,3)=c;
imwrite("finalb.tif", a,b,c);
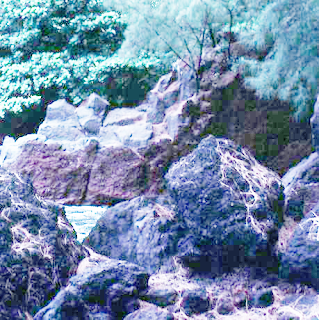
Here is the resulting image for part(B):
I will reproduce the 'final image' in Part(A) here so that we can more easily compare/contrast the final images in A and B.

COMPARISON:
The obvious difference between the two images streamA (part A image) and streamB (part B image) is that streamA looks more alive. What I mean to say is that the colours appear brighter and therefore provides detail which appears 'more full', when compared to streamB. In a way this makes sense as in streamA we are individually 'equalizing' each channel which would then similarly enhance or brighten each channel to its fullest. Whereas on the other hand, as in part B, we constructed streamB by equalizing an 'averaged' channel. Therefore, the resulting colours which come out from streamB are not as 'full' or bright.
Another difference which can be observed is that streamB looks 'grainier' than streamA. This is most evident if you look at the shaded rocks in streamB (towards the right). If you look right into this shaded region, you will see 'square pixelizations' taking place in this region. This can also be observed in streamA, however it is less evident.
Finally, in streamA you can observe that all the 'RGB' colours are enhanced or present. Whereas in the streamB image you can not see 'all' the colours present. It almost looks like one of the channels is missing or that we are looking at the 'streamA' image through a 'blue lens'. For example, if you look at the rocks in the foreground, you will see 'moss' in the streamA image but the moss does not 'pop' out in the streamB image. In a way this makes sense to me for if you look at the 2nd 'gray image' in partB (the green channel), you will notice that it is blurrier than the other 2 gray images produced. This leads me to believe that the 'greens' would get washed out when we 'combine' these 3 channels together to make a new 'streamB' image. Which of course is what we observed.
In conclusion, I believe that using the 'average' method to create the streamB image resulted in an image which is duller and shows less colours. If I was to enhance an image so that 'more colours' would be enhanced and amplified, I would equalize for each channel separately and then combine them to make a new and improved image.
1 comment:
Nice work!
Just one minor comment though: for part B), once you calculate the transform, you can simply use it for all channels.
Post a Comment